Download Analyzing and Visualizing Data with Microsoft Excel.70-779.Train4Sure.2018-05-24.25q.vcex
| Vendor: | Microsoft |
| Exam Code: | 70-779 |
| Exam Name: | Analyzing and Visualizing Data with Microsoft Excel |
| Date: | May 24, 2018 |
| File Size: | 3 MB |
How to open VCEX files?
Files with VCEX extension can be opened by ProfExam Simulator.
Discount: 20%

Demo Questions
Question 1
You have an Excel spreadsheet that contains a PivotChart.
You install Microsoft Power BI Publisher for Excel.
You need to add a tile for the PivotChart to a Power BI dashboard.
What should you do?
- From powerbi.com, click Get apps
- From powerbi.com, upload the Excel workbook
- From the File menu in Excel, click Publish
- From the Power BI tab in Excel, click Pin
Correct answer: C
Explanation:
References: https://docs.microsoft.com/en-us/power-bi/service-publish-from-excel References: https://docs.microsoft.com/en-us/power-bi/service-publish-from-excel
Question 2
You have an Excel workbook that contains two tables named User and Activity.
You plan to publish the workbook to the Power BI service.
Users will use Q&A in the Power BI service to perform natural language queries.
You need to ensure that the users can query the term employee and receive results from the User table.
What should you do before you publish to Power BI?
- From PowerPivot Settings, modify the Language options
- From PowerPivot Settings, modify the Categorization options
- From the Power Pivot model, edit the Synonyms
- From Workbook Connections, add a connection
Correct answer: C
Explanation:
References: http://blog.pragmaticworks.com/optimizing-power-bi-qa-with-synonyms-phrasing-using-cloud-modeling References: http://blog.pragmaticworks.com/optimizing-power-bi-qa-with-synonyms-phrasing-using-cloud-modeling
Question 3
You open C:\Data\Data.xlsx in Excel.
When you attempt to publish the file to Microsoft Power BI, you receive the following error message: “We couldn’t publish to Power BI. Make sure your workbook is saved as an Excel file (.xlsx or .xlsm) and is not password protected.”
You need to ensure that you can publish the file to Power BI.
What should you do first?
- Decrypt the workbook
- Copy the file to a network share
- Add a digital signature to the workbook
- Disable iterative calculation for the workbook
Correct answer: A
Explanation:
References: https://docs.microsoft.com/en-us/power-bi/service-publish-from-excel References: https://docs.microsoft.com/en-us/power-bi/service-publish-from-excel
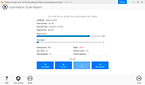
Question 4
You need to create a PivotChart as shown in the exhibit.

Which field should you use for each area? To answer, drag the appropriate fields to the correct areas. Each field may be used once, more than once, or not at all. You may need to drag the split bar between panes or scroll to view content.
NOTE: Each correct selection is worth one point.
Correct answer: To work with this question, an Exam Simulator is required.
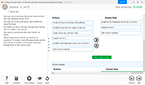
Question 5
You create the PivotChart shown in the exhibit.

In which area is Product and in which area is SalesAmount? To answer, drag the appropriate fields to the correct areas. Each field may be used once, more than once, or not at all. You may need to drag the split bar between panes or scroll to view content.
NOTE: Each correct selection is worth one point.
Correct answer: To work with this question, an Exam Simulator is required.
Question 6
Note: This question is part of a series of questions that use the same scenario. For your convenience, the scenario is repeated in each question. Each question presents a different goal and answer choices, but the text of the scenario is the same in each question in this series.
Start of repeated scenario.
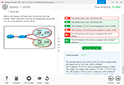
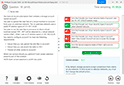
You are creating reports for a car repair company. You have four datasets in Excel spreadsheets. Four workbook queries load the datasets to a data model. A sample of the data is shown in the Data Sample exhibit.
Data Sample exhibit:


The data model is shown in the Data Model exhibit.

The tables in the model contain the following data:
- DailyRepairs has a log of hours and revenue for each day, workshop, and repair type. Every day, a log entry is created for each workshop, even if no hours or revenue are recorded for that day. Total Hours and Total Revenue column.
- Workshops have a list of all the workshops and the current and previous workshop managers. The format of the Workshop Manager column is always Firstname Lastname. A value of 1 in the IsLatest column indicates that the workshop manager listed in the record is the current workshop manager.
- RepairTypes has a list of all the repair types
- Dates has a list of dates from 2015 to 2018
End of repeated scenario.
When you attempt to create a relationship between DailyRepairs and Workshops, Power Pivot generates the following error message: “The relationship cannot be created because each column contains duplicate values. Select at least one column that contains only unique values”.
You need to ensure that you can create a valid relationship between the tables.
What should you do?
- In the Power Pivot model, change the data type for Workshop[ID] to General
- In the workbook query for Workshops, add an index column
- In the Power Pivot model, change the Table Behavior setting for Workshops
- In the workbook query for Workshops, filter [IsLatest] to equal 1
Correct answer: C
Explanation:
References: https://msdn.microsoft.com/en-us/library/hh560544(v=sql.110).aspx References: https://msdn.microsoft.com/en-us/library/hh560544(v=sql.110).aspx
Question 7
Note: This question is part of a series of questions that use the same scenario. For your convenience, the scenario is repeated in each question. Each question presents a different goal and answer choices, but the text of the scenario is the same in each question in this series.
Start of repeated scenario.
You are creating reports for a car repair company. You have four datasets in Excel spreadsheets. Four workbook queries load the datasets to a data model. A sample of the data is shown in the Data Sample exhibit.
Data Sample exhibit:


The data model is shown in the Data Model exhibit.

The tables in the model contain the following data:
- DailyRepairs has a log of hours and revenue for each day, workshop, and repair type. Every day, a log entry is created for each workshop, even if no hours or revenue are recorded for that day. Total Hours and Total Revenue column.
- Workshops have a list of all the workshops and the current and previous workshop managers. The format of the Workshop Manager column is always Firstname Lastname. A value of 1 in the IsLatest column indicates that the workshop manager listed in the record is the current workshop manager.
- RepairTypes has a list of all the repair types
- Dates has a list of dates from 2015 to 2018
End of repeated scenario.
You need to create a PivotChart that displays the month, the hours of the month, and the hours of the previous month, as shown in the following exhibit.

Which DAX formula should you use for the Total Hours Last Month measure? To answer, drag the appropriate fields to the correct targets. Each value may be used once, more than once, or not at all. You may need to drag the split bar between panes or scroll to view content.
NOTE: Each correct selection is worth one point.
Correct answer: To work with this question, an Exam Simulator is required.
Explanation:
References:https://technet.microsoft.com/en-us/library/ee634204(v=sql.105).aspxhttps://msdn.microsoft.com/en-us/library/ee634905.aspx References:
https://technet.microsoft.com/en-us/library/ee634204(v=sql.105).aspx
https://msdn.microsoft.com/en-us/library/ee634905.aspx
Question 8
Note: This question is part of a series of questions that use the same scenario. For your convenience, the scenario is repeated in each question. Each question presents a different goal and answer choices, but the text of the scenario is the same in each question in this series.
Start of repeated scenario.
You are creating reports for a car repair company. You have four datasets in Excel spreadsheets. Four workbook queries load the datasets to a data model. A sample of the data is shown in the Data Sample exhibit.
Data Sample exhibit:
The data model is shown in the Data Model exhibit.

The tables in the model contain the following data:
- DailyRepairs has a log of hours and revenue for each day, workshop, and repair type. Every day, a log entry is created for each workshop, even if no hours or revenue are recorded for that day. Total Hours and Total Revenue column.
- Workshops have a list of all the workshops and the current and previous workshop managers. The format of the Workshop Manager column is always Firstname Lastname. A value of 1 in the IsLatest column indicates that the workshop manager listed in the record is the current workshop manager.
- RepairTypes has a list of all the repair types
- Dates has a list of dates from 2015 to 2018
End of repeated scenario.
You create a measure named Average Revenue Per Hour that calculates the average revenue per hour.
You need to populate a cell in a worksheet to display the Average Revenue Per Hour where Repair Type is Engine.
Which Excel formula should you use?
- =CUBEMEMBER(“ThisWorkbookDataModel”, “[DailyRepairs]. [Avg Revenue Per Hour]”, CUBEMEMBER (“ThisWorkbookDataModel”, “[Dimensions]. [Repair Type]. [Engine]”))
- =CUBEVALUE(“ThisWorkbookDataModel”, “[Measures]. [Avg Revenue Per Hour]”, CUBEMEMBER (“ThisWorkbookDataModel”, “[Dimensions]. [Repair Type]. [Engine]”))
- =CUBEMEMBER(“ThisWorkbookDataModel”, “[DailyRepairs]. [Avg Revenue Per Hour]”, CUBEMEMBER (“ThisWorkbookDataModel”, “[RepairTypes]. [Repair Type]. [Engine]”))
- =CUBEVALUE(“ThisWorkbookDataModel”, “[Measures]. [Avg Revenue Per Hour]”, CUBEMEMBER (“ThisWorkbookDataModel”, “[RepairTypes]. [Repair Type]. [Engine]”))
Correct answer: B
Explanation:
References:https://support.office.com/en-us/article/cubevalue-function-8733da24-26d1-4e34-9b3a-84a8f00dcbe0https://www.tutorialspoint.com/advanced_excel_functions/advanced_excel_cube_cubemember_function.htm References:
https://support.office.com/en-us/article/cubevalue-function-8733da24-26d1-4e34-9b3a-84a8f00dcbe0
https://www.tutorialspoint.com/advanced_excel_functions/advanced_excel_cube_cubemember_function.htm
Question 9
Note: This question is part of a series of questions that use the same scenario. For your convenience, the scenario is repeated in each question. Each question presents a different goal and answer choices, but the text of the scenario is the same in each question in this series.
Start of repeated scenario.
You are creating reports for a car repair company. You have four datasets in Excel spreadsheets. Four workbook queries load the datasets to a data model. A sample of the data is shown in the Data Sample exhibit.
Data Sample exhibit:
The data model is shown in the Data Model exhibit.

The tables in the model contain the following data:
- DailyRepairs has a log of hours and revenue for each day, workshop, and repair type. Every day, a log entry is created for each workshop, even if no hours or revenue are recorded for that day. Total Hours and Total Revenue column.
- Workshops have a list of all the workshops and the current and previous workshop managers. The format of the Workshop Manager column is always Firstname Lastname. A value of 1 in the IsLatest column indicates that the workshop manager listed in the record is the current workshop manager.
- RepairTypes has a list of all the repair types
- Dates has a list of dates from 2015 to 2018
End of repeated scenario.
To the Dates table, you need to add a calculated column named Months Ago. Months Ago must display the number of calendar months before the current month. For example, if the current date is July 10, 2017, the Value of Months Ago will be 0 for all the dates in July 2017, 1 for all the dates in June 2017, and 2 for all the dates in May 2017.
How should you complete the DAX formula? To answer, select the appropriate options in the answer area.
NOTE: Each correct selection is worth one point.
Correct answer: To work with this question, an Exam Simulator is required.
Explanation:
References:https://msdn.microsoft.com/en-us/library/ee634914.aspxhttps://msdn.microsoft.com/en-us/library/ee634567.aspxhttps://msdn.microsoft.com/en-us/library/ee634554.aspx References:
https://msdn.microsoft.com/en-us/library/ee634914.aspx
https://msdn.microsoft.com/en-us/library/ee634567.aspx
https://msdn.microsoft.com/en-us/library/ee634554.aspx
Question 10
You have 12 sales reports stored in a folder as CSV files. Each report represents one month of sales data for a year. The reports have the same structure.
You need to analyze the entire year of sales data.
Which three actions should you perform in sequence? To answer, move the appropriate actions from the list of actions to the answer area and arrange them in the correct order.
Correct answer: To work with this question, an Exam Simulator is required.
Explanation:
References:https://powerpivotpro.com/2017/01/import-csv-files-folder-filenames-excel/https://www.masterdataanalysis.com/ms-excel/import-csv-files-folder-excel/https://support.office.com/en-us/article/create-a-data-model-in-excel-87e7a54c-87dc-488e-9410-5c75dbcb0f7b References:
https://powerpivotpro.com/2017/01/import-csv-files-folder-filenames-excel/
https://www.masterdataanalysis.com/ms-excel/import-csv-files-folder-excel/
https://support.office.com/en-us/article/create-a-data-model-in-excel-87e7a54c-87dc-488e-9410-5c75dbcb0f7b
HOW TO OPEN VCE FILES
Use VCE Exam Simulator to open VCE files
HOW TO OPEN VCEX AND EXAM FILES
Use ProfExam Simulator to open VCEX and EXAM files
ProfExam at a 20% markdown
You have the opportunity to purchase ProfExam at a 20% reduced price
Get Now!